

The graph shows information about the average number of visitors entering a museum in summer and winter in 2005. Summarize the information by selecting and reporting the main features and make comparisons where relevant.
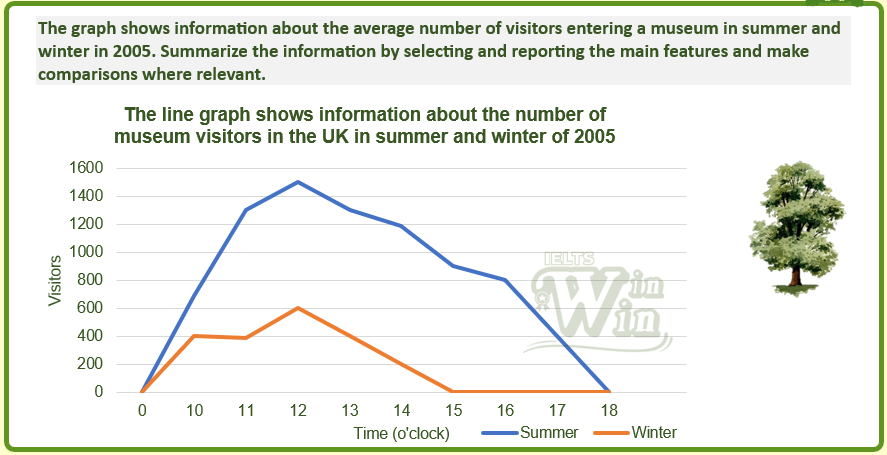
The line chart illustrates how many people went to a British museum in the summer and winter of 2005.
Overall, fewer people went to this museum in the winter than they did in the warmer season. However, during both times of the year, the daily peak time was at midday, although it seems like the building closed earlier in the winter.
In the summer, within the first eleven hours of the day, the head count soared up to around 1300 people and peaked at approximately 1500 people at noon. It then slowly descended by around 700 between 12.00 p.m. and 4.00 p.m., and continued dropping to zero at a more considerable rate towards 6.00 p.m..
On a smaller scale, this pattern was followed by the winter’s figures. The first half of the day witnessed the number of walk-ins climbing gradually to 400, which then fell slightly before making a recovery to its high at 600. Since noon, there were fewer and fewer museum-goers present, setting a consistent drop until the museum was free of any visitors from 3.00 p.m. onwards.
New words:
✨Average attendance rate: lượt người tham quan trung bình
✨Peak time: thời gian cao điểm
✨Head count: số lượng người
✨Soared up: tăng lên (nhiều & nhanh chóng)
✨Peaked at: chạm đỉnh ở
✨Descended: hạ xuống
✨Walk-ins: lượt người đi vào (toà nhà, cửa hàng,...)
✨Making a recovery: phục hồi, tăng trở lại
✨Museum-goers: người đi bảo tàng
✨Present: hiện diện
✨Consistent: đồng đều, nhất quán